Wetland Monitoring & Assessment
Our Team in the Wetland Monitoring & Assessment
The San Francisco Estuary Institute comprises over sixty scientists, technologists, and designers who offer a wide range of expertise. Each team member, in her or his own way, helps to define environmental problems, advance public debate about them through sound science, and support consensus-based solutions that improve environmental planning, management, and policy development.

Projects Related to the Wetland Monitoring & Assessment
 California Aquatic Resource Inventory (CARI)
The California Aquatic Resources Inventory (CARI) is a Geographic Information System (GIS) based map of wetlands, streams, and riparian areas within California that is hosted online through EcoAtlas.
The Riparian Zone Estimator Tool (RipZET) is a decision support tool developed by the San Francisco Estuary Institute and Aquatic Science Center for the California Riparian Habitat Joint Venture and the California Water Resources Control Board to assist in the visualization and characterization of riparian areas in the watershed context.
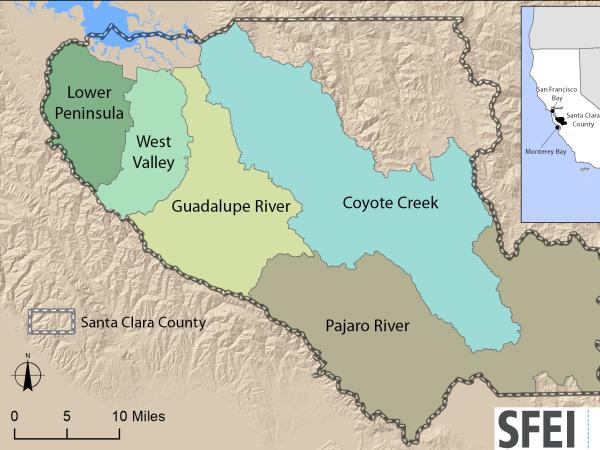 Santa Clara Valley Water District Priority D5 Project's Watershed Condition Assessments (2010 to present)
https://www.valleywater.org/project-updates/2012-d5-ecological-data-collection-and-analysisSFEI and the Santa Clara Valley Water District's (Valley Water) Priority D-5 Project have been conducting baseline ecological condition assessments in Santa Clara County, CA to characterize the distribution and abundance of stream and wetlands in five major watersheds, and to assess the overall ecological conditions of streams in the watersheds based on the California Rapic Assessment Method for streams (CRAM). The surveys employ the state's recommended Wetland and Riparian Area Monitoring Plan's watershed aproach that includes the use of GIS-base maps of aquatice resources (BAARI), and spatially-balanced ambient stream condition surveys using CRAM.
 EcoAtlas
EcoAtlas is a set of tools for generating, assembling, storing, visualizing, sharing, and reporting environmental data and information.
 Russian River Watershed Projects at the San Francisco Estuary Institute
Our projects in the Russian River Watershed help us to understand our past, understand our present, and envision our future. Learn more about what SFEI is doing in partnership with others to advance our scientific understanding of this valuable landscape.
 Contaminant Data Download and Display (CD3)
Contaminant Data Display and Download Tool or CD3 is an innovative visualization tool for accessing water quality data for the San Francisco Bay-Delta and northern montane regions. It is the primary tool for accessing and downloading the San Francisco Bay Regional Monitoring Program’s (RMP) long-term dataset and other project data stored in SFEI's Regional Data Center (RDC).
 Wetlands Regional Monitoring Project
This Prop 50 - funded project was a three-year effort to monitor and track changes in Bay Area wetland condition. This wetland monitoring toolkit meets basic information needs for managing wetlands: to develop a scientific framework with standard methods for monitoring wetlands and for interpreting the results, and to regularly report the findings to the public. These monitoring tools are intended to help provide a public measure of the environmental costs or benefits of most wetland management actions.
 Baylands Ecosystem Habitat Goals Project
SFEI's Letitia Grenier served as lead scientist of the Baylands Ecosystem Habitat Goals Project, which yielded a report called The Baylands and Climate Change: What We Can Do. The report is an update to the 1999 Baylands Ecosystem Habitat Goals, which for the first time set comprehensive restoration goals for the San Francisco Bay estuary. Produced by a collaborative of 21 management agencies working with a multi-disciplinary team of over 100 scientists, it synthesizes the latest science—particularly advances in the understanding of climate change and sediment supply—and incorporates projected changes through 2100 to generate new recommendations for achieving and sustaining healthy baylands ecosystems.
 Visualizing and Sharing Intensive Data Assessments
With California's drought rapidly changing the outlook for natural resources, decision-makers must be equipped with information and tools that facilitate clear and rapid decisions. The proposed grant would fund the standardization, visualization, and sharing of Level 3 data.
 California Rapid Assessment Method (CRAM)
CRAM is a standardized, scientifically defensible rapid assessment method for monitoring the ecological conditions of wetlands throughout California. Because it is standardized, one can compare ecological conditions of wetlands locally, regionally and statewide.
- 1 of 2
- next ›
Publications related to the Wetland Monitoring & Assessment
The Institute has collectively produced more than 1300 reports, articles, and other publications over the course of its 24-year existence. The following list represents those publications associated with this individual program and its focus areas.
Nothing found
Year of Publication: 2005
. A practical guide for the development of a wetland rapid assessment method: the California experience. J. of the American Water Resources Association. 2005;.
. A Watershed Monitoring Strategy for Napa County. Napa,: San Francisco Estuary Institute; 2005 p. 34. Report No.: 428.  (1.14 MB)
. Characterization of mercury concentrations in suspended sediment loads in Guadalupe River and Coyote Creek, San Jose, California: Can TMDL targets be met?. Henry J. Kaiser Convention Center, Oakland California; 2005. (3.27 MB)
. Concentrations and loads of mercury, PCBs, and OC pesticides in the lower Guadalupe River, San Jose,California: Water Years 2003 and 2004. San Francisco Estuary Institute; 2005 p. 80. Report No.: 409. (1.61 MB)
. Human influences on nitrogen and phosphorus concentrations in creek and river waters of the Napa and Sonoma watersheds, northern San Francisco Bay, California. Oakland: San Francisco Estuary Institute; 2005 . Report No.: 421. (1.72 MB)
. Pinole Creek Watershed Sediment Source Assessment: A sediment budget approach highlighting watershed-scale sediment-related processes and supply to the Bay [Internet]. Henry J. Kaiser Convention Center, Oakland, CA; 2005. http://www.sfei.org/presentations_posters/SOE_05/index_poster.html (2.02 MB)
. Pinole Creek Watershed Sediment Source Assessment. A technical report of the Regional Watershed Program, San Francisco Estuary Institute (SFEI), Oakland, California. (appendix only). Oakland, CA: San Francisco Estuary Institute; 2005 . Report No.: 316. (1.29 MB)
. Pinole Creek Watershed Sediment Source Assessment. A technical report of the Regional Watershed Program, San Francisco Estuary Institute (SFEI), Oakland, California. (plotter-sized landslide map only). Oakland, CA: San Francisco Estuary Institute; 2005. (19.55 MB)
. Pinole Creek Watershed Sediment Source Assessment. A technical report of the Regional Watershed Program, San Francisco Estuary Institute (SFEI), Oakland, California. (report only -- no appendix). Oakland, CA: San Francisco Estuary Institute; 2005 . Report No.: 316. (4.28 MB)
. South Bay Salt Pond Restoration Project Interactive Map. Henry J. Kaiser Convention Center, Oakland California; 2005. (3.64 MB)
. The Wetland Project Tracker. Henry J. Kaiser Convention Center, Oakland California; 2005. (3.45 MB)
. Trends in Suspended Sediment Input to the San Francisco Bay for Local Tributaries Watersheds. San Francisco Estuary Institute; 2005 . (7.9 MB)
Year of Publication: 2004
. Analysis of Reference Tidal Channel Plan Form for the Montezuma Wetlands Restoration Project. Oakland, CA: San Francisco Estuary Institute; 2004 . Report No.: 80. (5.96 MB)
- ‹ previous
- 8 of 20
- next ›