Cyanide Site Specific Objective 3-year Rolling Average

As part of the cyanide site-specific objective, NPDES dischargers are required to calculate annually the three-year rolling average of cyanide concentrations in water in each segment of the Bay, based on RMP data.a This table presents the segment average and corresponding trigger levels in the Basin Plan. The average includes data from randomized as well as historical sites in the segments, although it excludes data from the historical reference site outside the Golden Gate.
| Bay Segment | Trigger (μg/L) | 2015, 2017, & 2019 Rolling Average (μg/L) | Number of Samples Included in Average | Notes |
|---|---|---|---|---|
| Lower South Bay | 1 | 0.52 | 15 | |
| South Bay | 1 | 0.45 | 12 | Historical Station BA30 included |
| Central Bay | 1 | 0.36 | 11 | Historical Station BC10 included |
| San Pablo Bay | 1 | 0.82 | 6 | |
| Suisun Bay | 1 | 0.35 | 6 |
Sample Locations
- 2011 Cyanide Sample Locations Map
- 2013 Cyanide Sample Locations Map
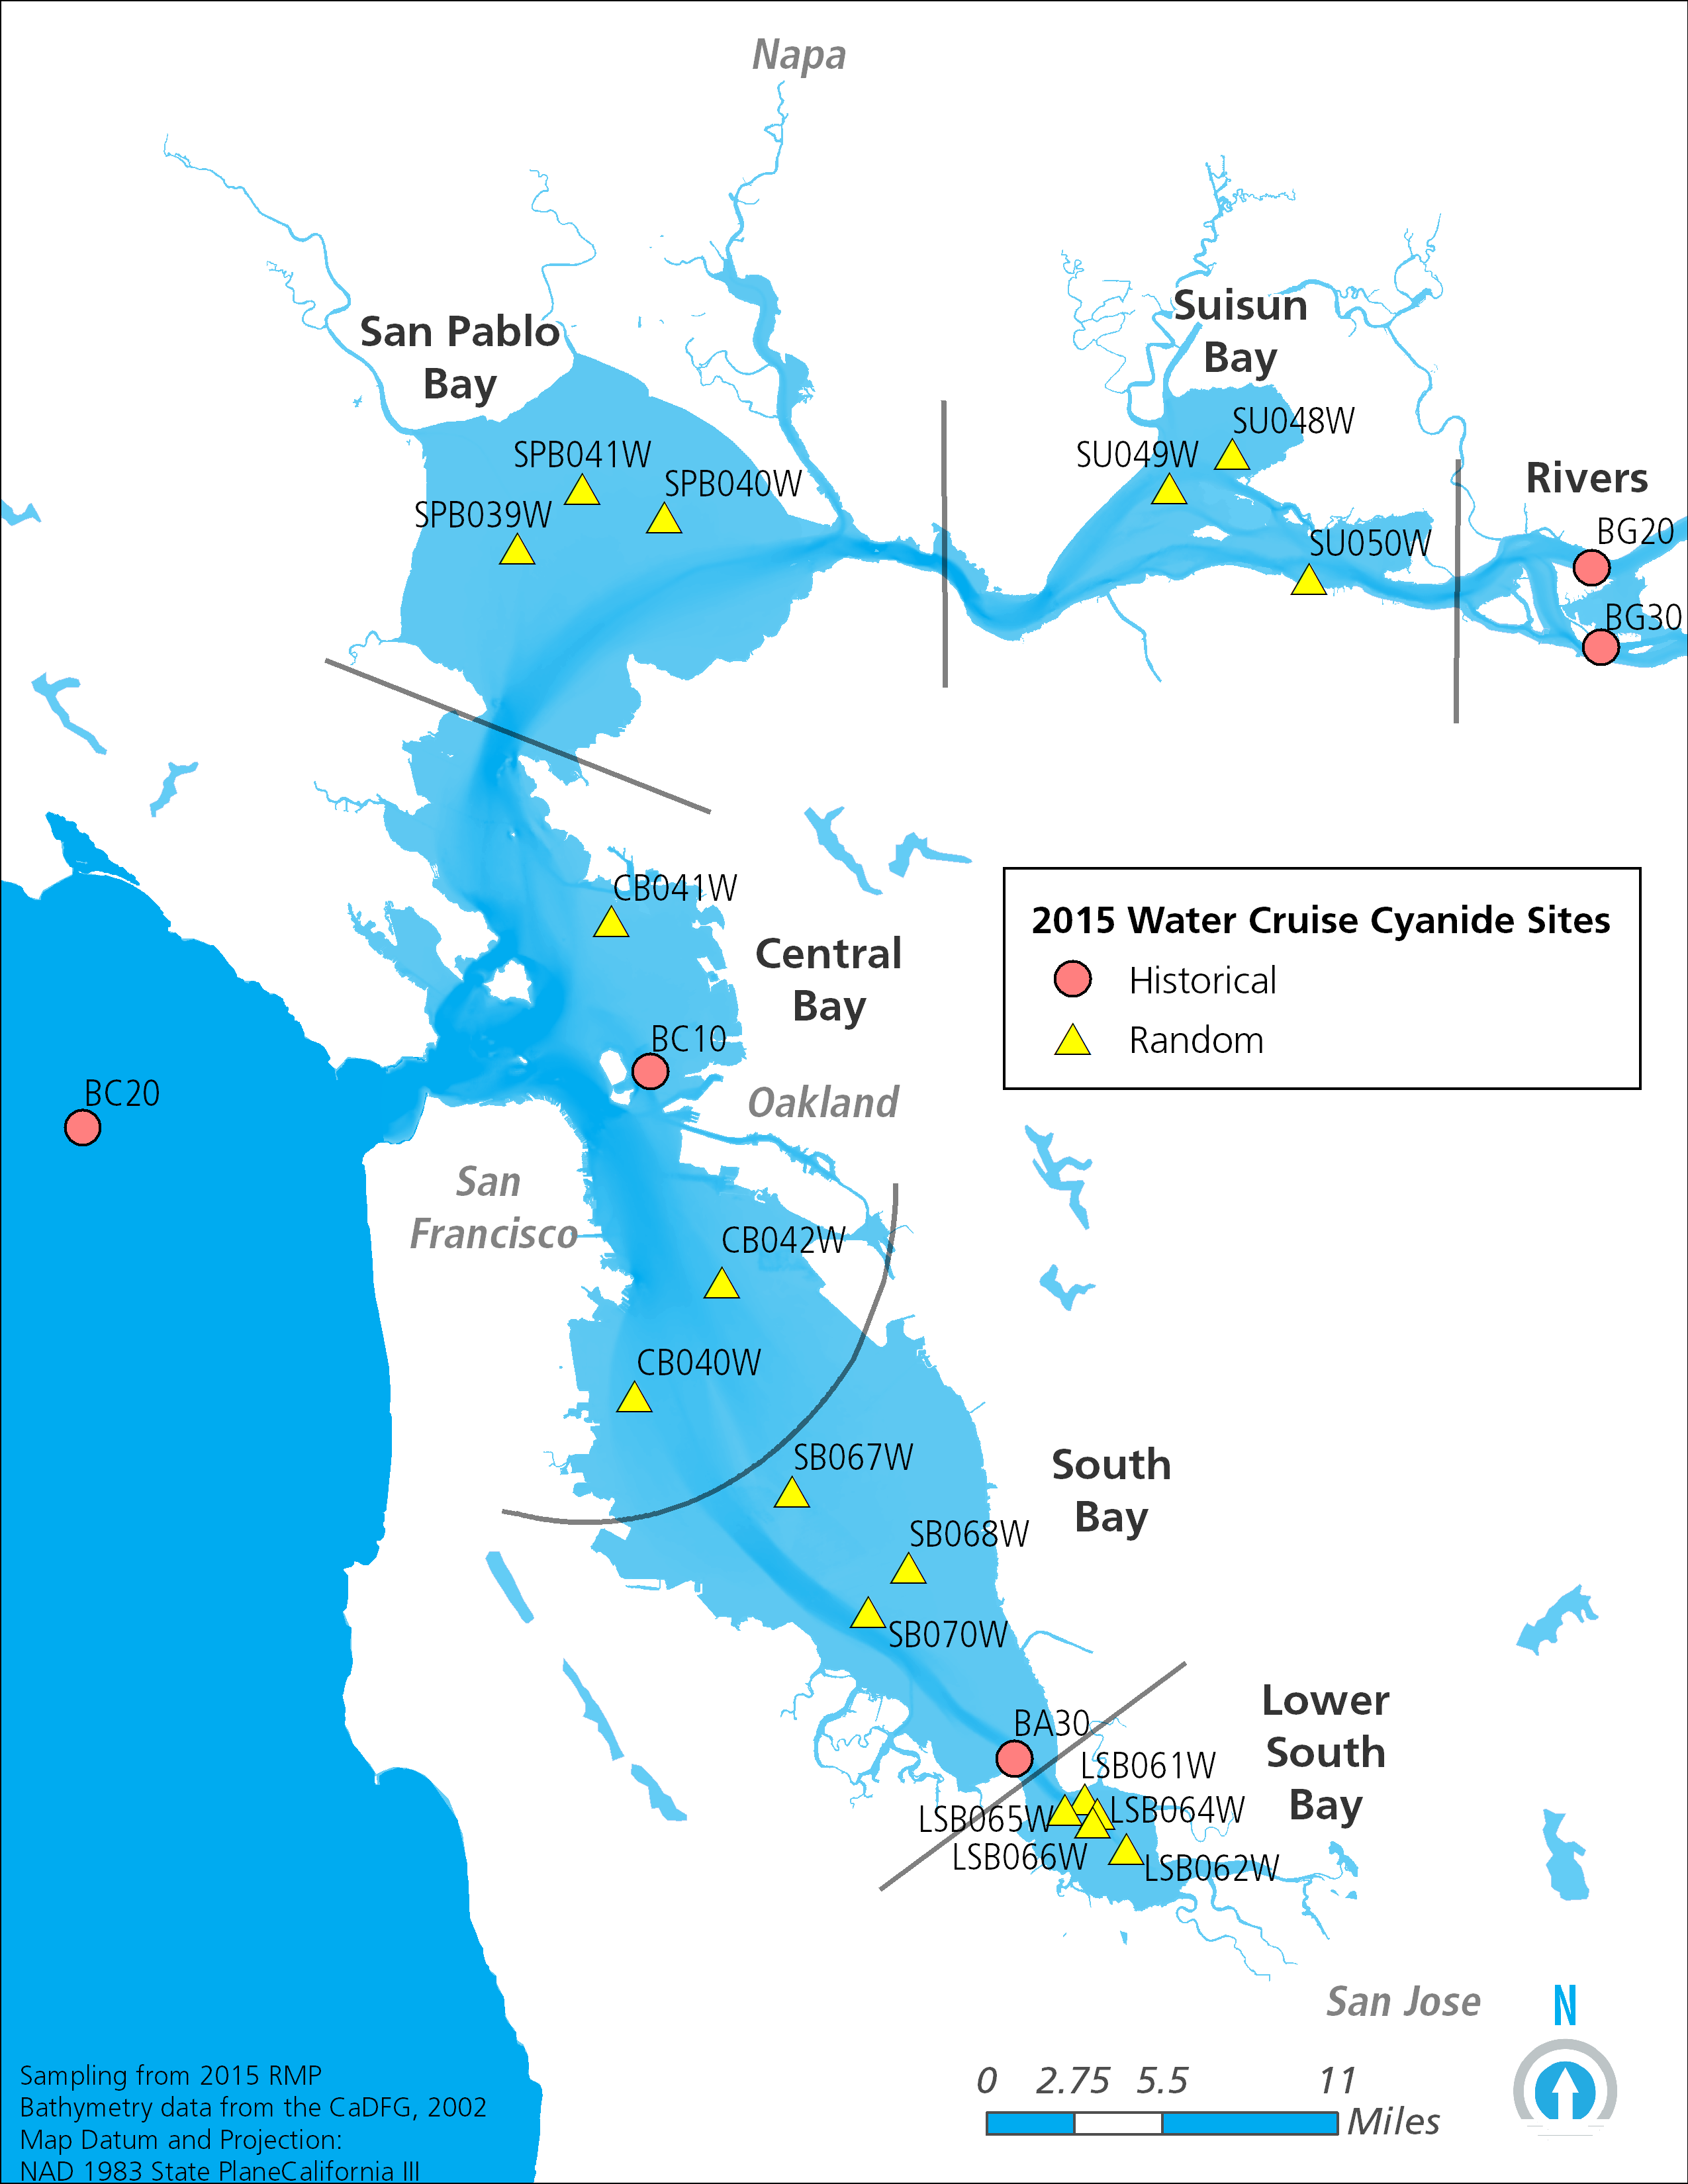
- 2015 Cyanide Sample Locations Map
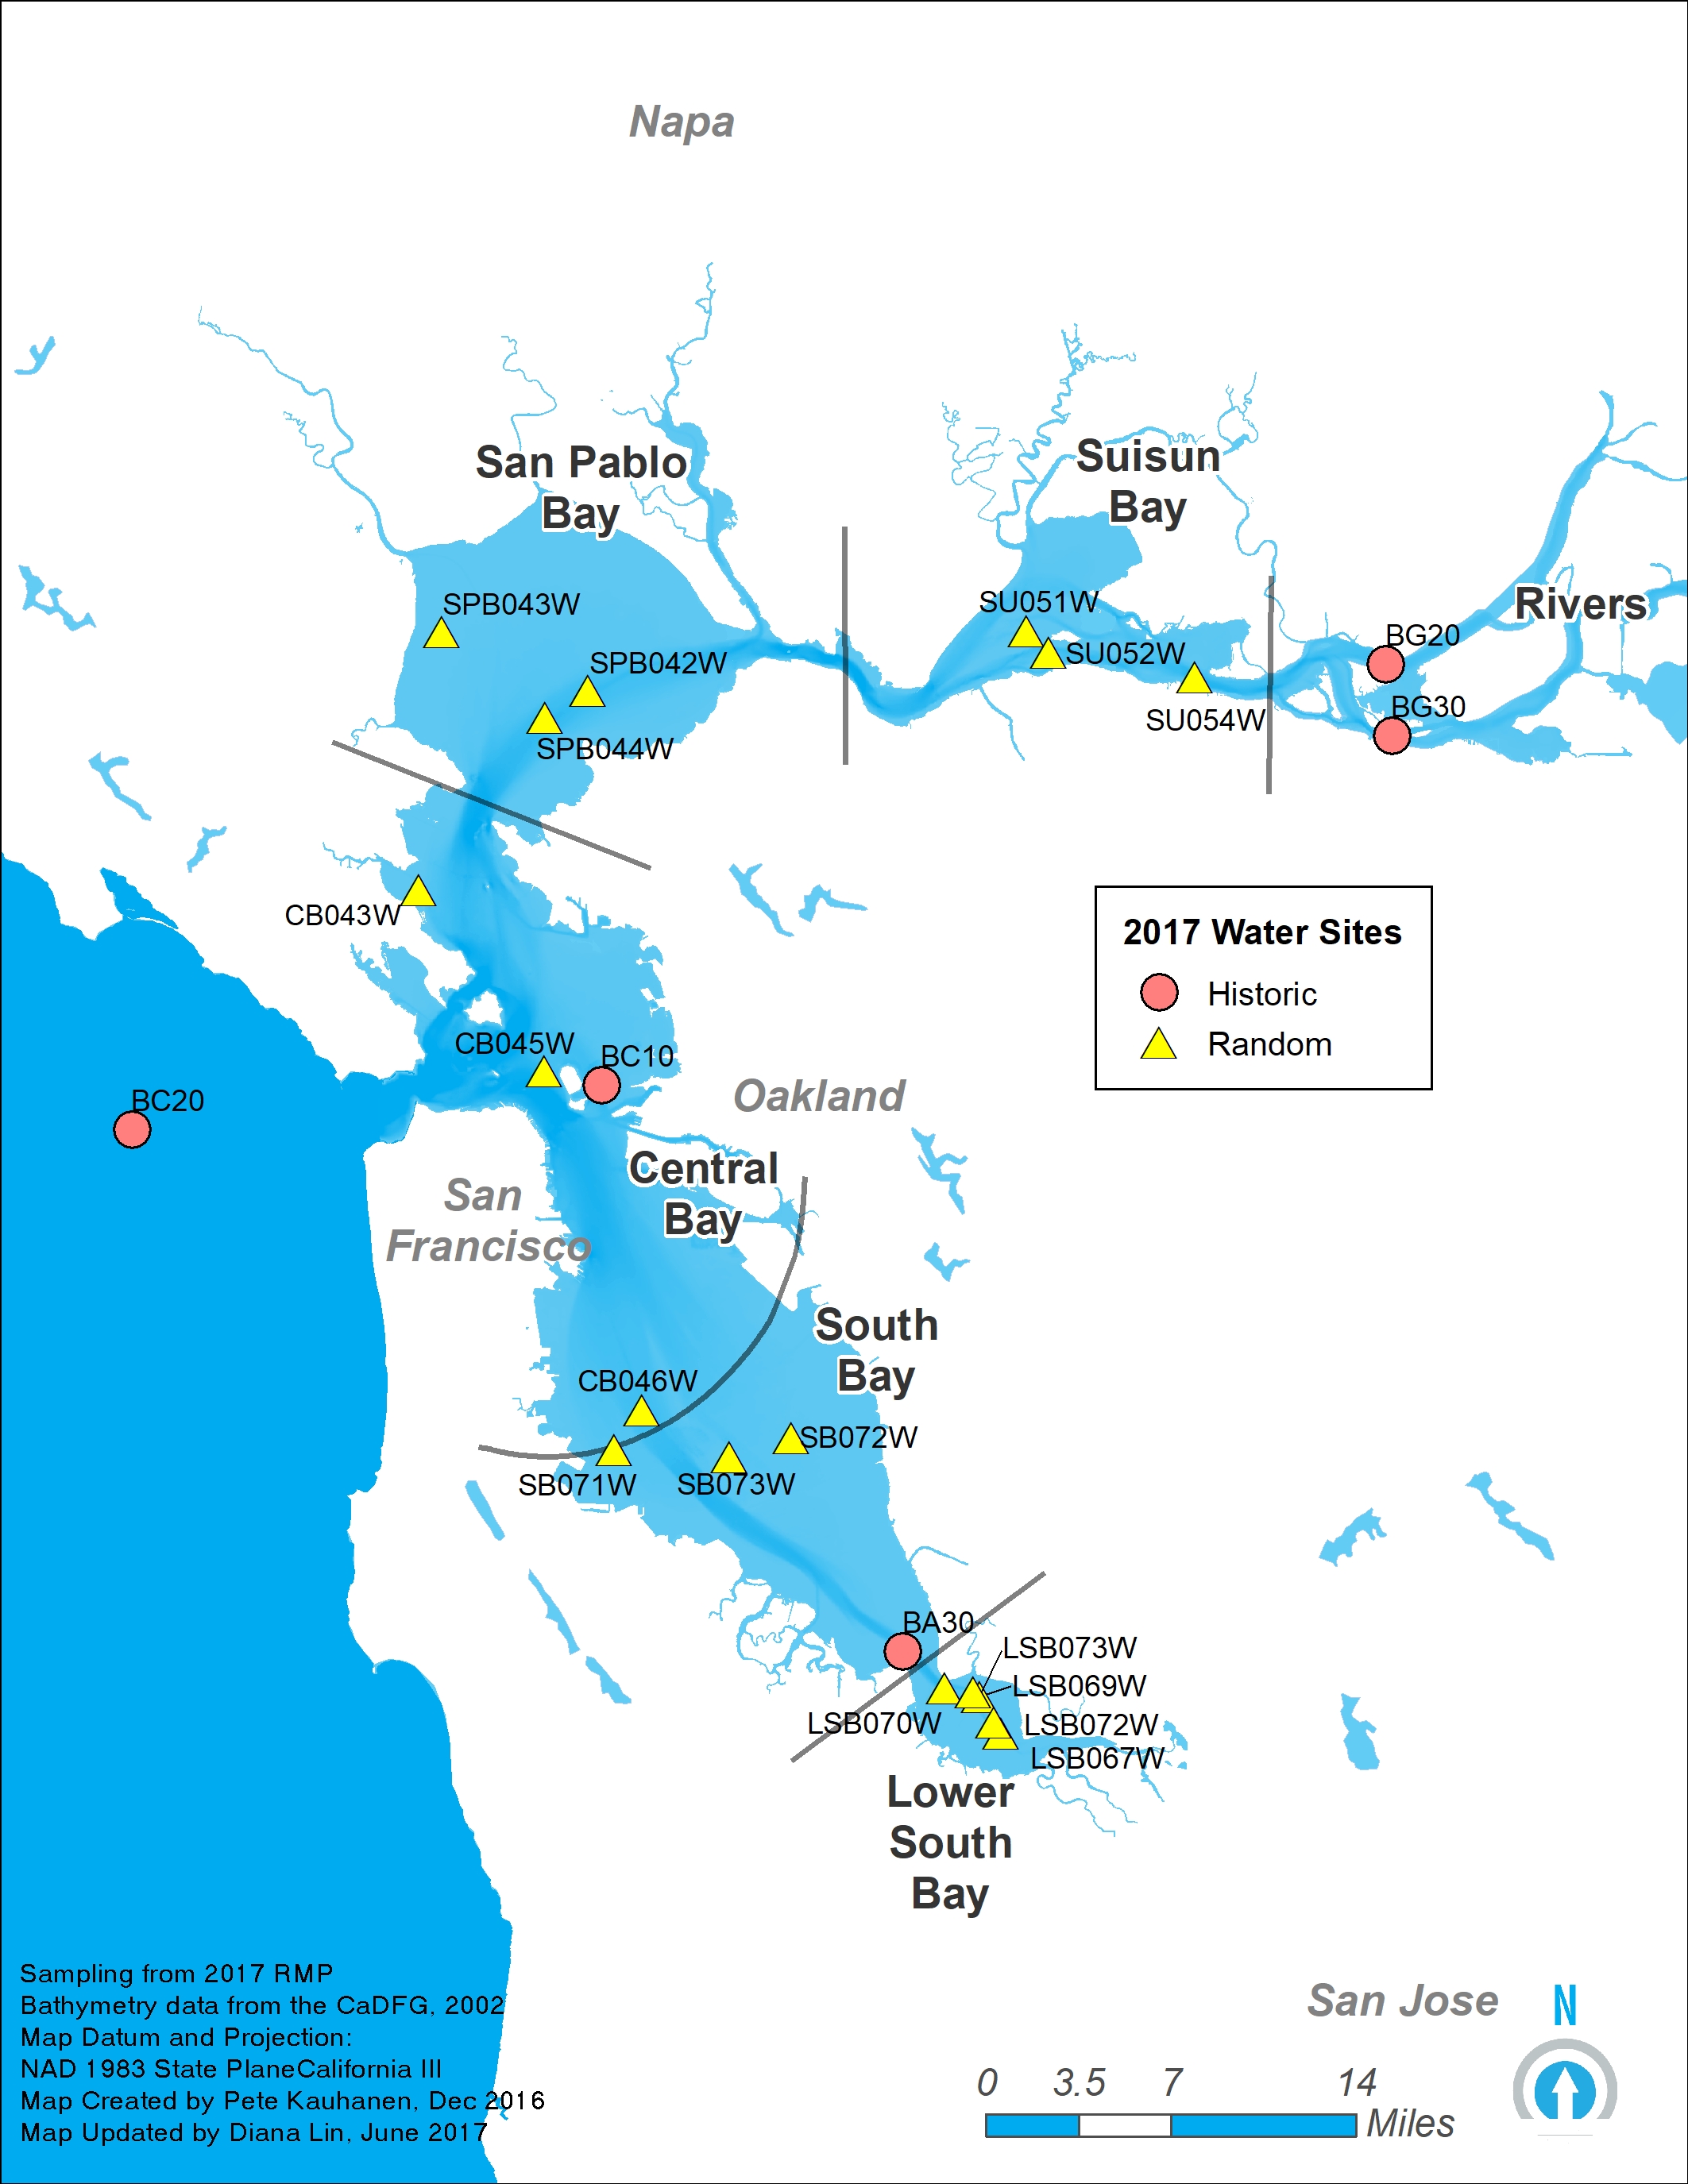
- 2017 Cyanide Sample Locations Map
- 2019 Cyanide Sample Locations Map
a In 2011, the RMP reduced the frequency of water and sediment sampling to biennial. Water samples are now collected during odd-numbered years. Therefore, the current cyanide 3-year rolling averages include 2011, 2013, and 2015 data.
Key Materials
2019 Update to Cyanide Rolling Averages - Presentation