Library
Our library features many hundreds of entries.
To search among them, click "Search" below to pull down options, including filtering by document type, author, year, and keyword.
Find these options under "Show only items where." Or you can also sort by author, title, type, and year clicking the headings below.
Export 1847 results:
Filters: Filter is [Clear All Filters]
2006. Pinole Creek Sediment Source Assessment: Pavon Creeks Sub-basin. SFEI Contribution No. 515. San Francisco Estuary Institute. p 67.
2005. Sources, Pathways, and Loadings: 5-Year Work Plan (2005-2009). SFEI Contribution No. 406. San Francisco Estuary Institute. p 25.
2001. Sediment loads transported from the Delta: Implications for management of pollutants of concern. SFEI Contribution No. 231. San Francisco Estuary Institute.
2007. Stream Inventory Report for La Honda Creek: Prepared for the Midpeninsula Regional Open Space District. SFEI Contribution No. 529. San Francisco Estuary Institute.
2014. Estimating Regional Pollutant Loads for San Francisco Bay Area Tributaries using the Regional Watershed Spreadsheet Model( RWSM): Year’s 3 and 4 Progress Report. San Francisco Estuary Institute - Aquatic Science Center: Richmond, CA.
2013. Pollutants of concern (POC) loads monitoring data progress report, water year (WY) 2012. SFEI: Richmond, CA.
2008. Alameda Creek Sediment Forum.
2008. Review of sediment gauging studies in Alameda Creek Watershed. SFEI Contribution No. 571. San Francisco Estuary Institute.
2002. Report of Science Advisors: Solano County Natural Community Conservation Plan Habitat Conservation Plan. SFEI Contribution No. 272.
2009. Watershed Specific and Regional Scale Suspended Sediment Load Estimates for Bay Area Small Tributaries. SFEI Contribution No. 566. Oakland, Ca.
2003. A review of urban runoff processes in the Bay Area: Existing knowledge, conceptual models, and monitoring recommendations. SFEI Contribution No. 66. San Francisco Estuary Institute: Oakland, CA.
2003. Regional Watershed Program.
2002. Pathogen Occurrence and Analysis in Relation to Water Quality Attainment in San Francisco Bay Area Watersheds. SFEI Contribution No. 128.
2004. Fluvial Geomorphology, Hydrology, and Riparian Habitat of La Honda Creek Along the Hwy 84 Transportation Corridor, San Mateo County, California. SFEI Contribution No. 78. San Francisco Estuary Institute /CA State Univ of Fresno.
2014. Pollutants of Concern (POC) Loads Monitoring Data Progress Report: Water Years (WYs) 2012 and 2013. SFEI Contribution No. 708. SFEI: Richmond, CA. pp 1-84.
2003. Channel Geomorphology Assessment: A component of the watershed management plan for the Sulphur Creek watershed, Napa County, California. SFEI Contribution No. 68. San Francisco Estuary Institute: Oakland, CA.
2003. Channel Geomorphology Assessment: A component of the watershed management plan for the Carneros Creek watershed, Napa County, California. SFEI Contribution No. 67. San Francisco Estuary Institute: Oakland, CA.
2002. Napa River Sediment TMDL Baseline Study: Geomorphic Processes and Habitat form and function in Soda Creek. SFEI Contribution No. 63. San Francisco Estuary Institute: Oakland, CA.
2023. San Francisco Bay Sediment Modeling and Monitoring Workplan. SFEI Contribution No. 1100. San Francisco Estuary Institute: Richmond, CA.
This document was prepared with guidance gained through two RMP Sediment Workgroup workshops held in late 2022 and early 2023. Given the variety of participants involved, this Workplan encompasses interests beyond San Francisco Bay RMP funders. We thank the attendees for their contributions.
In 2020, the Sediment Workgroup (SedWG) of the Regional Monitoring Program for Water Quality in San Francisco Bay (RMP) completed a Sediment Monitoring and Modeling Strategy (SMMS) which laid out a conceptual level series of data and information gaps and generally recommended the use of both empirical data collection and modeling tools to answer initial high priority management questions (McKee et al., 2020). At the time, the SMMS promoted the use of surrogates such as time-continuous turbidity measurements for cross-section flux modeling within the Bay without an understanding of existing Bay hydrodynamic models, their strengths, weaknesses, and potential uses for understanding coupled Bay-mudflat-marsh processes. Since then, the Wetland Regional Monitoring Program (WRMP, www.wrmp.org) has generally promoted the use of coupling monitoring and modeling techniques to inform wetlands sediment management decisions. In addition, he completion of the Sediment for Survival report (a RMPEPA funded collaboration) and the further development of sediment conceptual models has also advanced the need for a coupled dynamic modeling and monitoring program that has the capacity to explore more complex management questions (Dusterhoff et al., 2021; SFEI, 2023). Such a program will take time to develop, but will be more cost-efficient and adaptable and allow for more timely answers to pressing questions.
2004. The concentration and load of PCBs, OC pesticides, and mercury associated with suspended sediments in the lower Guadalupe River, San Jose, California. A Technical Report of the Regional Watershed Program. SFEI Contribution No. 86. San Francisco Estuary Institute: Oakland, CA.
2016. Sources, Pathways and Loadings: Multi-Year Synthesis with a Focus on PCBs and Hg. SFEI Contribution No. 773.
2012. Pollutants of Concern (POC) Loads Monitoring Data, Water Year (WY) 2011. San Francisco Estuary Institute: Richmond, CA.
2004. San Pedro Creek Watershed Sediment Source Analysis, Volume III: Tributary sediment source assessment. SFEI Contribution No. 87. San Francisco Estuary Institute: Oakland, CA.
2010. Concentrations of PCBs and Hg in soils, sediments and water in the urbanized Bay Area: Implications for best management. SFEI Contribution No. 608.
. 2006. Review of methods to reduce urban stormwater loads. SFEI Contribution No. 429. San Francisco Estuary Institute: Oakland. p 150xx.
2000. Estuary News RMP Insert 2000. Estuary News.
2002. Estimation of Total Mercury Fluxes Entering San Francisco Bay from the Sacramento and San Joaquin River Watersheds (Technical Memo). SFEI Contribution No. 260. San Francisco Estuary Institute: Oakland, CA.
2009. Concentrations and Loads of Trace Contaminants in the Zone 4 Line A Small Tributary, Hayward, California: Water Year 2007. SFEI Contribution No. 563. San Francisco Estuary Institute: Oakland,Ca.
2016. Pollutants of concern (POC) reconnaissance monitoring final progress report, water year (WY) 2015. SFEI Contribution No. 787.
2022. Small Tributaries Pollutants of Concern Reconnaissance Monitoring: Application of Storm-event Loads and Yields-Based and Congener-Based PCB Site Prioritization Methodologies. SFEI Contribution No. 1067.
Stormwater agencies in the San Francisco Bay Area are identifying watershed areas that are polluted with PCBs in order to prioritize management efforts to reduce impairment in the Bay caused by PCBs carried in stormwater. Water sampling during storms has been used to characterize PCB concentrations but management prioritization based on the comparison of concentrations between watersheds is made difficult due to variations in flow and sediment erosion between storms and in relation to varying land use. In addition, identifying PCB source areas within priority watersheds has proven complex and costly. To address these challenges, the San Francisco Bay Regional Monitoring Program (RMP) has developed two new interpretive methods based on storm-event PCB yields (PCBs mass per unit area per unit time) and fingerprints of Aroclors (commercial PCB mixtures) that make existing data more useful for decision-making.
The objectives of this study were to:
- Apply the yield method to the regional stormwater dataset and provide new rankings,
- Estimate the presence of Aroclors in samples where congener data are available
- Evaluate data weaknesses and recommend watersheds to resample, and
- Classify watersheds into high, medium, and low categories for potential management.
2020. Sediment Monitoring and Modeling Strategy. Sediment Monitoring and Modeling Strategy. SFEI Contribution No. 1016. San Francisco Estuary Institute: Richmond, CA.
2013. Distribution of biologic, anthropogenic, and volcanic constituents as a proxy for sediment transport in the San Francisco Bay Coastal System. Marine Geology 345, 113-142.
2024. Where the rubber meets the road: Emerging environmental impacts of tire wear particles and their chemical cocktails. Science of the Total Environment 927.
About 3 billion new tires are produced each year and about 800 million tires become waste annually. Global dependence upon tires produced from natural rubber and petroleum-based compounds represents a persistent and complex environmental problem with only partial and often-times, ineffective solutions. Tire emissions may be in the form of whole tires, tire particles, and chemical compounds, each of which is transported through various atmospheric, terrestrial, and aquatic routes in the natural and built environments. Production and use of tires generates multiple heavy metals, plastics, PAH's, and other compounds that can be toxic alone or as chemical cocktails. Used tires require storage space, are energy intensive to recycle, and generally have few post-wear uses that are not also potential sources of pollutants (e.g., crumb rubber, pavements, burning). Tire particles emitted during use are a major component of microplastics in urban runoff and a source of unique and highly potent toxic substances. Thus, tires represent a ubiquitous and complex pollutant that requires a comprehensive examination to develop effective management and remediation. We approach the issue of tire pollution holistically by examining the life cycle of tires across production, emissions, recycling, and disposal. In this paper, we synthesize recent research and data about the environmental and human health risks associated with the production, use, and disposal of tires and discuss gaps in our knowledge about fate and transport, as well as the toxicology of tire particles and chemical leachates. We examine potential management and remediation approaches for addressing exposure risks across the life cycle of tires. We consider tires as pollutants across three levels: tires in their whole state, as particulates, and as a mixture of chemical cocktails. Finally, we discuss information gaps in our understanding of tires as a pollutant and outline key questions to improve our knowledge and ability to manage and remediate tire pollution.
2011. Who's Monitoring What Where? Developing the Central Valley Water Quality Monitoring Inventory.
2001. Results of the San Francisco Bay Seafood Consumption Study. SFEI Contribution No. 230.
1993. Teaching About the San Francisco Bay and Delta - An Activities and Resource Guide, 2nd Ed. SFEI Contribution No. 174. San Francisco Estuary Institute: Richmond, Ca. p 500.
. 2002. 2000 Pulse of the Estuary: Monitoring and Managing Contamination in the San Francisco Estuary. SFEI Contribution No. 88. San Francisco Estuary Institute: Oakland, CA.
2022. Shallow Groundwater Response to Sea-Level Rise: Alameda, Marin, San Francisco, and San Mateo Counties. Pathways Climate Institute and San Francisco Estuary Institute.
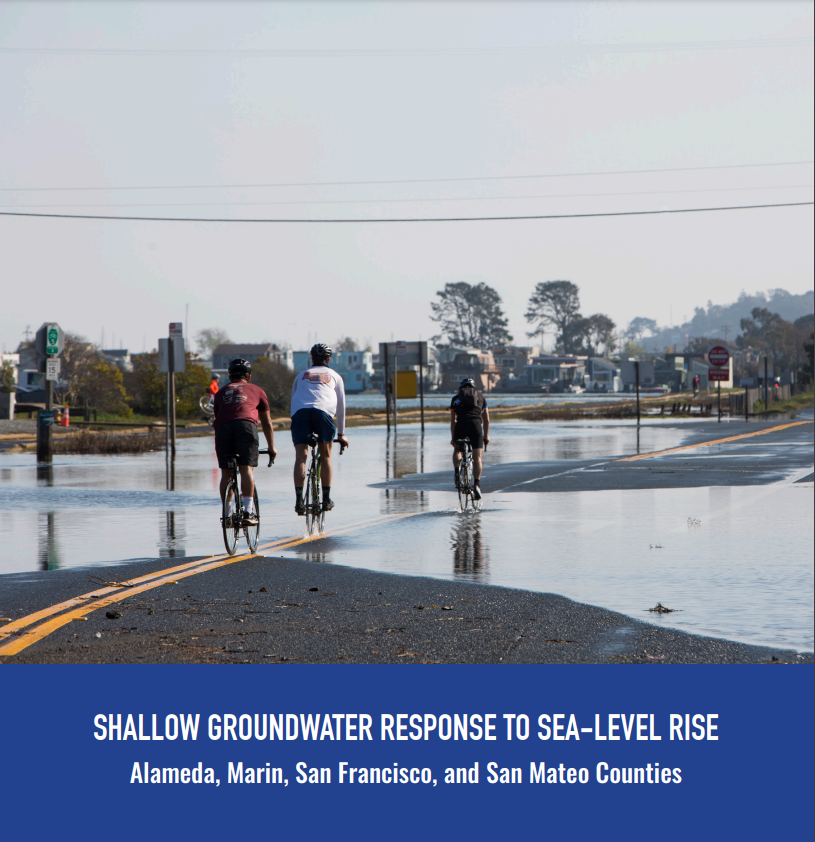 The response of shallow groundwater to sea-level rise is a relatively new field of study. For low-lying coastal communities, sea-level rise adaptation efforts must consider the potential for groundwater rise to avoid maladaptation. The need to better understand this slow and chronic threat was identified as a critical data gap in the San Francisco Bay Area’s (Bay Area’s) adaptation efforts during the Bay Area Groundwater and Sea-Level Rise Workshop in 2019.
Pathways Climate Institute LLC (Pathways) and the San Francisco Estuary Institute (SFEI) gathered and analyzed multiple data sets and collaborated with city and county partners to analyze and map the existing “highest annual” shallow groundwater table and its likely response to future sea-level rise. This effort covers four counties (Alameda, Marin, San Francisco, San Mateo) and was funded by the Bay Area Council’s California Resilience Challenge. The study focused on the San Francisco Bay side of each county and does not include the Pacific coastline of Marin, San Francisco, nor San Mateo Counties. An advisory committee composed of city and county representatives provided essential support by gathering data and reviewing depth-to-groundwater maps. Additional academic and agency advisors participated in project team meetings and informed project direction. This effort produced the following publicly available data and online tools to support adaptation efforts:
- Existing and future condition depth to groundwater GIS data available for download (geodatabase format).
- A StoryMap providing background information and graphical representations of the processes and impacts of groundwater rise.
- Web maps showing: (1) existing depth to groundwater; and (2) a comparison of the extent of emergent groundwater to the extent of coastal flooding under various sea-level-rise scenarios.
2000. The Pulse of the Estuary: Tracking Contamination with the Regional Monitoring Program 1993-1998. SFEI Contribution No. 100. San Francisco Estuary Institute.
2016. Microplastic pollution is widely detected in US municipal wastewater treatment plant effluent. Environmental Pollution 218, 1045-1054.
Municipal wastewater effluent has been proposed as one pathway for microplastics to enter the aquatic environment. Here we present a broad study of municipal wastewater treatment plant effluent as a pathway for microplastic pollution to enter receiving waters. A total of 90 samples were analyzed from 17 different facilities across the United States. Averaging all facilities and sampling dates, 0.05 ± 0.024 microparticles were found per liter of effluent. Though a small value on a per liter basis, even minor municipal wastewater treatment facilities process millions of liters of wastewater each day, yielding daily discharges that ranged from ∼50,000 up to nearly 15 million particles. Averaging across the 17 facilities tested, our results indicate that wastewater treatment facilities are releasing over 4 million microparticles per facility per day. Fibers and fragments were found to be the most common type of particle within the effluent; however, some fibers may be derived from non-plastic sources. Considerable inter- and intra-facility variation in discharge concentrations, as well as the relative proportions of particle types, was observed. Statistical analysis suggested facilities serving larger populations discharged more particles. Results did not suggest tertiary filtration treatments were an effective means of reducing discharge. Assuming that fragments and pellets found in the effluent arise from the 'microbeads' found in many cosmetics and personal care products, it is estimated that between 3 and 23 billion (with an average of 13 billion) of these microplastic particles are being released into US waterways every day via municipal wastewater. This estimate can be used to evaluate the contribution of microbeads to microplastic pollution relative to other sources (e.g., plastic litter and debris) and pathways (e.g., stormwater) of discharge.
2004. Determining Economic Impacts of Aquatic Plant Management in California Waters. SFEI Contribution No. 106.
2024. Investigation of quaternary ammonium compounds (QACs) in wastewater effluent, influent, biosolids and environmental matrices in San Francisco Bay. SFEI Contribution No. 1196. San Francisco Estuary Institute: Richmond, CA.
Quaternary ammonium compounds (QACs) are surfactants widely used in a variety of consumer products, particularly as antimicrobials. The COVID-19 pandemic has increased use of products containing QACs. This is of concern because QACs can be toxic to aquatic life at low concentrations. This study was undertaken to evaluate the concentrations of 21 QACs in municipal wastewater influent, effluent, and biosolids from three treatment plants in the San Francisco Bay Area. The QACs detected in wastewater influent in the highest concentrations are those commonly used as antimicrobials in disinfectant products, indicating that disinfectants are likely a large source of QACs to wastewater. While wastewater treatment removed QACs in the aqueous phase, as evidenced by much lower concentrations in effluents than influents, total levels present in treated effluent were still on the order of hundreds of ng/L to low μg/L. High amounts of QACs were found sorbed to biosolids, which could provide another environmental release route.
QACs were also observed in San Francisco Bay water, sediment, and urban stormwater runoff samples collected as part of ongoing monitoring by the Regional Monitoring Program for Water Quality in San Francisco Bay (RMP). Wastewater effluents and stormwater runoff are both pathways for QACs to enter San Francisco Bay. We classify QACs as a Possible Concern for the Bay in the RMP’s tiered risk-based framework for emerging contaminants, based primarily on the limited number of ambient Bay samples analyzed, and recommend additional screening of Bay water in the future.
2018. Dissolved Oxygen in South San Francisco Bay: Variability, Important Processes, and Implications for Understanding Fish Habitat. SFEI Contribution No. 911. San Francisco Estuary Institute : Richmond, CA.
1999. Impacts of Nonindigenous Species on Subtidal Benthic Assemblages in the San Francisco Estuary. SFEI Contribution No. 329. p 16.
1999. Sediment Conditions near Wastewater Discharges in San Francisco Bay. San Francisco Estuary Institute: Oakland, CA.
2022. Building Capacity of the California Wetland Program Plan to Protect and Restore Vernal Pools. SFEI Contribution No. 1087. San Francisco Estuary Institute: Richmond. CA. p 30.
This report describes the updates to the vernal pool habitat map, the development of the ambient baseline ecological condition survey of vernal pool systems within the Central Valley, and the development and results of the habitat development curve. A fictional project example shows how CRAM and the vernal pool complex CDFs and HDCs can help project proponents and the regulatory agencies think critically about project designs (using CRAM Attributes and Metrics as a standard measure), evaluate project conditions within a regional landscape context, and monitor project performance over time to ensure that project goals are met.
Funding for this report was provided through an agreement with the U.S. Environmental Protection Agency (USEPA). This report does not necessarily reflect the views and policies of USEPA nor does the mention of trade names or commercial products within this report constitute endorsement or recommendation for use.
2001. RMP Redesign Presentation.
2001. 2001 Quality Assurance Project Plan: Regional Monitoring Program for Trace Substances. SFEI Contribution No. 33. San Francisco Estuary Institute.
2000. Results of the Benthic Pilot Study 1994 - 1997, Part 1. SFEI Contribution No. 39. San Francisco Estuary Institute: Richmond, CA.
2011. Final Project Report for the Demonstration Project in Three Critical Coastal Area Watersheds. San Francisco Estuary Institute: Richmond, CA.
2004. Re-design Process of the San Francisco Estuary Regional Monitoring Program for Trace Substances (RMP). SFEI Contribution No. 109. San Francisco Estuary Institute: Oakland, CA.
2003. Surveillance for previously unmonitored organic contaminants in the San Francisco Estuary. Marine Pollution Bulletin 46, 1102-1110 . SFEI Contribution No. 295.
2003. Causes of Sediment Toxicity to Mytilus galloprovincialis in San Francisco Bay, California. Archive of Environmental Contamination Toxicology 45, 486-491 . SFEI Contribution No. 296.
2013. Demonstration Watershed Assessment For the Tahoe Basin Using the Wetland & Riparian Area Monitoring Plan. SFEI Contribution No. 703. San Francisco Estuary Institute: Richmond, CA.
2017. Lower Peninsula Watershed Condition Assessment 2016: Southwest San Francisco Bay, Santa Clara County, San Francisquito to Stevens Creeks. Technical memorandum prepared for the Santa Clara Valley Water District. . SFEI Contribution No. 809. San Francisco Estuary Institute: Richmond. p 53.
2003. Surveillance for previously unmonitored organic contaminants in the San Francisco Estuary. Marine Pollution Bulletin 46, 1102-1110.
1999. 1999 Quality Assurance Project Plan. SFEI Contribution No. 33. San Francisco Esturary Institute: Oakland.
2015. Project: Statistical Design, Analysis and Guidance on the Pajaro and Lower Peninsula Watershed Assessments. TASK 3: GRTS Survey Designs and Sample Draws Memorandum – Pajaro and Lower Peninsula Watersheds. SFEI Contribution No. 763.
2015. Project: Statistical Design, Analysis and Guidance on the Pajaro and Lower Peninsula Watershed Assessments. TASK 2: Basis of Assessment Memorandum – Review Existing GIS Data & Develop Stream Assessment Study Designs for the Pajaro and Lower Peninsula Wate. SFEI Contribution No. 762.
2004. Assessment of Macrobenthos Response to Sediment Contamination in the San Francisco Estuary (published in Environmental Toxicology and Chemistry). Environmental Toxicology and Chemistry 23, 2178.
2007. Patterns and trends in sediment toxicity in the San Francisco Estuary. Environmental Research 105, 145-155.
2020. Santa Clara County Five Watersheds Assessment: A Synthesis of Ecological Data Collection and Analysis Conducted by Valley Water. . SFEI Contribution No. 963. San Francisco Estuary Institute: Richmond. CA. p 71.
This report synthesizes the baseline assessments for Santa Clara County’s five watersheds to present similarities, differences, and compare ecological condition in streams across watersheds and their subregions, San Francisco Bay-Delta ecoregion, and statewide based on CRAM. It also interprets the assessment results and comparisons to identify risks to stream conditions, and opportunities for stream stewardship. Project D5’s baseline assessments establish a monitoring and assessment framework for evaluating the performance of Valley Water’s programs, projects, maintenance activities, and on-the-ground stewardship actions.
2020. Coyote Creek Watershed Reassessment 2020 Ambient Stream Condition Survey Design and Monitoring Plan: A Review of the Original 2010 Survey Design and Development of the 2020 Reassessment Strategy. . SFEI Contribution No. 1055. San Francisco Estuary Institute: Richmond. CA. p 18.
This technical report describes the ten-year ambient stream condition reassessment survey design and monitoring plan (or strategy) for the Coyote Creek watershed. Because the reassessment employed (and modified) the 2010 sample draw, essential background information about the original 2010 probability-based survey design, sample draw, and field assessment outcomes were provided.
2016. Lower Peninsula Watershed Condition Assessment 2016. Technical memorandum prepared for the Santa Clara Valley Water District - Priority D5 Project. SFEI Contribution No. 809. San Francisco Estuary Institute: Richmond, CA. p 49.
In 2016 The Santa Clara Valley Water District and its consultants conducted a watershed wide survey to characterize the distribution and abundance of the aquatic resources within the Lower Peninsula watershed wtihin Santa Clara County, CA based on available GIS data, and to assess the overall ecological condition of streams within the watershed based on a statistically based, random sample design and the California Rapid Assessment Method for streams (CRAM).
2007. Final Project Report: Investigations of Sources and Effects of Pyrethroid Pesticides in Watersheds of the San Francisco Estuary. SFEI Contribution No. 523. San Francisco Estuary Institute: Oakland.
2013. Statistical Design, Analysis, and Graphics for the Guadalupe River Watershed Assessment 2012. SFEI Contribution No. 687. San Francisco Estuary Institute: Richmond, CA.
2008. San Francisco Estuary National Water Quality Monitoring Network Pilot Study Report. SFEI Contribution No. 548. p 70.
2008. Exchange and Integration of Monitoring Data to Address Management Questions at Multiple Scales.
2008. Sampling in the Freshwater Reaches of the Lower Delta for the Sediment Quality Objectives Measures.
2021. Guidance for Restoration of Natural and Nature-Based Features in the Wetland-Upland Transition Zone. San Francisco Estuary Institute, California State Coastal Conservancy: Richmond, CA.