Library
Our library features many hundreds of entries.
To search among them, click "Search" below to pull down options, including filtering by document type, author, year, and keyword.
Find these options under "Show only items where." Or you can also sort by author, title, type, and year clicking the headings below.
2014. Santa Rosa Plain Wetlands Profile: A Demonstration of the CaliforniaWetland and Riparian Area Monitoring Plan. SFEI Contribution No. 726. San Francisco Estuary Institute - Aquatic Science Center: Richmond, CA. p 46.
2008. Science Support for the Surface Water Ambient Monitoring Program, SWRCB Agreement No. 03-200-250-0. SFEI Contribution No. 546. San Francisco Estuary Institute.
2018. Screening of Pharmaceuticals in San Francisco Bay Wastewater. SFEI Contribution No. 910. San Francisco Estuary Institute : Richmond, CA.
1987. The Screening of Problems Relating to the San Francisco Bay_Delta. SFEI Contribution No. 138. San Francisco Estuary Insitute: Richmond, CA. p 77.
2006. Second Annual Report Montezuma Wetlands Restoration Project Technical Review Team. SFEI Contribution No. 516.
2008. A Sediment Budget for Two Reaches of Alameda Creek. SFEI Contribution No. 550. San Francisco Estuary Institute.
1999. Sediment Conditions near Wastewater Discharges in San Francisco Bay. San Francisco Estuary Institute: Oakland, CA.
2000. Sediment Contamination in San Leandro Bay, CA. SFEI Contribution No. 48. San Francisco Estuary Institute: Oakland, CA.
2023. Sediment Deposition and Accretion Data from a Tidal Salt Marsh in South San Francisco Bay, California 2021-2022. U.S. Geological Survey Western Ecological Research Center .
The U.S. Geological Survey, Western Ecological Research Center collected sediment and accretion data at a wave-exposed tidal salt marsh in South San Francisco Bay, California. Sediment traps and feldspar marker horizons (MH) were deployed along transects of increasing distance from the sediment source, at primary, secondary and tertiary marsh channels/bay. Data were collected bi-monthly over two month periods in summer 2021 and winter 2021/2022. Included here are trap and MH plot locations, calculated sediment fluxes at each station by deployment period, annual accretion rates, and covariates associated with sediment deposition and accretion including vegetation structure and elevation. This project aimed to assess the temporal and spatial patterns in sediment deposition in order to better understand sediment delivery and marsh resilience to sea-level rise.
2023. Sediment deposition, erosion, and bathymetric change in San Francisco Bay, California, 1971–1990 and 1999–2020. United States Geological Survey Pacific Coastal and Marine Science Center: Santa Cruz, CA.
Bathymetric change analyses document historical patterns of sediment deposition and erosion, providing valuable insight into the sediment dynamics of coastal systems, including pathways of sediment and sediment-bound contaminants. In 2014 and 2015, the Office for Coastal Management, in partnership with the National Oceanic and Atmospheric Administration (NOAA) Office of Coastal Management, provided funding for new bathymetric surveys of large portions of San Francisco Bay. A total of 93 bathymetric surveys were conducted during this 2-year period, using a combination of interferometric sidescan and multibeam sonar systems. These data, along with recent NOAA, U.S. Geological Survey (USGS), U.S. Army Corps of Engineers, and private contractor surveys collected from 1999 to 2020 (hereinafter referred to as 2010s), were used to create the most comprehensive bathymetric digital elevation models (DEMs) of San Francisco Bay since the 1980s. Comparing DEMs created from these 2010s surveys with USGS DEMs created from NOAA’s 1971–1990 (hereinafter referred to as 1980s) surveys provides information on the quantities and patterns of erosion and deposition in San Francisco Bay during the 9 to 47 years between surveys. This analysis reveals that in the areas surveyed in both the 1980s and 2010s, the bay floor lost about 34 million cubic meters of sediment since the 1980s. Results from this study can be used to assess how San Francisco Bay has responded to changes in the system, such as sea-level rise and variation in sediment supply from the Sacramento-San Joaquin Delta and local tributaries, and supports the creation of a new, system-wide sediment budget. This report provides data on the quantities and patterns of sediment volume change in San Francisco Bay for ecosystem managers that are pertinent to various sediment-related issues, including restoration of tidal marshes, exposure of legacy contaminated sediment, and strategies for the beneficial use of dredged sediment.
2023. Sediment Deposition, Erosion, and Bathymetric Change in San Francisco Bay, California, 1971–1990 and 1999–2020. United State Geological Survey: Santa Cruz, CA.
Bathymetric change analyses document historical patterns of sediment deposition and erosion, providing valuable insight into the sediment dynamics of coastal systems, including pathways of sediment and sediment-bound contaminants. In 2014 and 2015, the California Ocean Protection Council, in partnership with the National Oceanic and Atmospheric Administration (NOAA) Office of Coastal Management, provided funding for new bathymetric surveys of large portions of San Francisco Bay. A total of 93 bathymetric surveys were conducted during this 2-year period, using a combination of interferometric sidescan and multibeam sonar systems. These data, along with recent NOAA, U.S. Geological Survey (USGS), U.S. Army Corps of Engineers, and private contractor surveys collected from 1999 to 2020 (hereinafter referred to as 2010s), were used to create the most comprehensive bathymetric digital elevation models (DEMs) of San Francisco Bay since the 1980s. Comparing DEMs created from these 2010s surveys with USGS DEMs created from NOAA’s 1971–1990 (hereinafter referred to as 1980s) surveys provides information on the quantities and patterns of erosion and deposition in San Francisco Bay during the 9 to 47 years between surveys. This analysis reveals that in the areas surveyed in both the 1980s and 2010s, the bay floor lost about 34 million cubic meters of sediment since the 1980s. Results from this study can be used to assess how San Francisco Bay has responded to changes in the system, such as sea-level rise and variation in sediment supply from the Sacramento-San Joaquin Delta and local tributaries, and supports the creation of a new, system-wide sediment budget. This report provides data on the quantities and patterns of sediment volume change in San Francisco Bay for ecosystem managers that are pertinent to various sediment-related issues, including restoration of tidal marshes, exposure of legacy contaminated sediment, and strategies for the beneficial use of dredged sediment.
2021. Sediment for Survival: A Strategy for the Resilience of Bay Wetlands in the Lower San Francisco Estuary. SFEI Contribution No. 1015. San Francisco Estuary Institute: Richmond, CA.
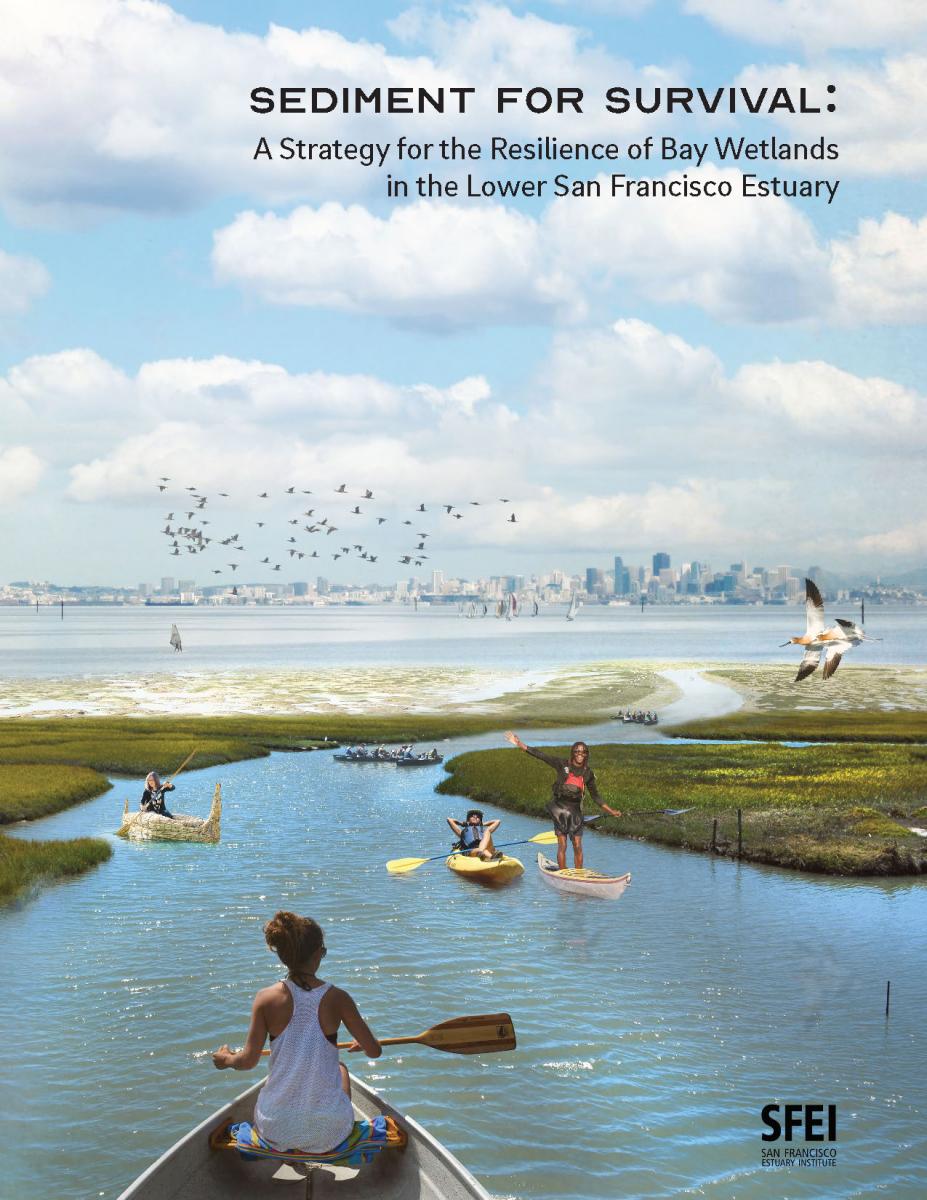
This report analyses current data and climate projections to determine how much natural sediment may be available for tidal marshes and mudflats and how much supplemental sediment may be needed under different future scenarios. These sediment supply and demand estimates are combined with scientific knowledge of natural physical and biological processes to offer a strategy for sediment delivery that will allow these wetlands to survive a changing climate and provide benefits to people and nature for many decades to come. The approach developed in this report may also be useful beyond San Francisco Bay because shoreline protection, flood risk-management, and looming sediment deficits are common issues facing coastal communities around the world.
The resilience of San Francisco Bay shore habitats, such as tidal marshes and mudflats, is essential to all who live in the Bay Area. Tidal marshes and tidal flats (also known as mudflats) are key components of the shore habitats, collectively called baylands, which protect billions of dollars of bay-front housing and infrastructure (including neighborhoods, business parks, highways, sewage treatment plants, and landfills). They purify the Bay’s water, support endangered wildlife, nurture fisheries, and provide people access to nature within the urban environment. Bay Area residents showed their commitment to restoring these critical habitats when they voted for a property tax to pay for large-scale tidal marsh restoration. However, climate change poses a great threat, because there may not be enough natural sediment supply for tidal marshes and mudflats to gain elevation fast enough to keep pace with sea-level rise.
2001. Sediment loads transported from the Delta: Implications for management of pollutants of concern. SFEI Contribution No. 231. San Francisco Estuary Institute.
2020. Sediment Monitoring and Modeling Strategy. Sediment Monitoring and Modeling Strategy. SFEI Contribution No. 1016. San Francisco Estuary Institute: Richmond, CA.
2008. Sediment Quality Assessments in the San Francisco Estuary. SFEI Contribution No. 574. San Francisco Estuary Institute: Oakland, Ca.
2015. Sediment Supply, deposition, and transport in the Flood Control Facilities of Arroyo Mocho and Arroyo Las Positas from 2006-2014. . SFEI Contribution No. 771. San Francisco Estuary Institue: Richmond, CA.
2018. Sediment Supply to San Francisco Bay. SFEI Contribution No. 842. San Francisco Estuary Institute : Richmond, CA.
2002. Sediment Toxicity Identification Evaluations San Francisco Bay Regional Monitoring Program for Trace Substances. SFEI Contribution No. 243. San Francisco Estauary Institute: Richmond, CA.
2001. Sediment Toxicity Identification Evaluations San Francisco Bay RMP for Trace Substances - Progress Report. SFEI Contribution No. 46. San Francisco Estuary Institute: Richmond, CA.
1987. The Segmentation of the San Francisco Bay/Delta. SFEI Contribution No. 135. San Francisco Estuary Institute: Richmond, CA. p 18.
2024. Selenium Concentrations in Water and Clams in North San Francisco Bay, 2019-2020. SFEI Contribution No. 1116. San Francisco Estuary Institute: Richmond, CA.
The Regional Monitoring Program for Water Quality in San Francisco Bay (RMP) started implementing a new design for North Bay selenium (Se) sampling in 2019 after a long-term USGS program was terminated in 2017. To determine if the RMP sampling and analysis methods are producing similar results to the USGS study, we compared Se concentrations and stable isotope values in clams at two stations in Suisun Bay, California, that were sampled by the USGS long-term monitoring program from 1995-2010 and the RMP in 2019-2020. We also compared Se concentrations in water (dissolved and particulate) from the RMP Status and Trends sampling in Suisun Bay (1993-2019) to the samples collected as part of this study.
Spatial patterns in clam Se concentrations between the USGS and RMP studies were similar, with lower concentrations at Station 4.1 (Suisun Bay) than at Station 8.1 (Carquinez Strait). Se concentrations at both stations were consistently lower for the RMP samples than those reported in the long-term USGS dataset. Stable isotope values for δ13C and δ15N were similar for the USGS and RMP samples with δ13C and δ15N more enriched at Station 8.1 than 4.1. However, there was not close alignment of the RMP samples to the USGS long-term average, particularly at Station 8.1. Average dissolved Se concentrations in water were consistently lower than the long-term average at Station 4.1 and similar to or above the long-term RMP Status and Trends (S&T) average at Station 8.1. Particulate Se concentrations at Stations 4.1 and 8.1 were nearly one-third of the long-term S&T average in Suisun Bay, likely due to a change in methods for calculating particulate Se.
Additional information is needed to evaluate whether the lower Se concentrations measured in clams as part of the RMP study could be suggestive of declining Se concentrations in North Bay clams between 2010 and 2019 or an artifact of the new analytical lab. Additional data from samples collected by the USGS from 2011-2017 should be examined to fill the gap between the datasets. Continued RMP monitoring will also be valuable in evaluating long-term trends.
2012. Selenium Fractionation and Speciation in Final Effluents of Selected San Francisco Bay Area Municipal Wastewater Treatment Facilities. San Francisco Estuary Institute: Richmond.
2018. Selenium in Muscle Plugs of White Sturgeon from North San Francisco Bay, 2015-2017. SFEI Contribution No. 929. San Francisco Estuary Institute : Richmond, CA.
2010. Selenium in the Grasslands Watershed. San Francisco Estuary Institute: Oakland, CA. pp 267-294.
2018. Selenium in White Sturgeon from North San Francisco Bay: The 2015-2017 Sturgeon Derby Study - (Coming Soon). SFEI Contribution No. 897. San Francisco Estuary Institute : Richmond, CA.
2019. Selenium in White Sturgeon from North San Francisco Bay: The 2015-2017 Sturgeon Derby Study. SFEI Contribution No. 897. San Francisco Estuary Institute: Richmond, CA.
This report presents the findings from a study evaluating selenium concentrations in white sturgeon (Acipenser transmontanus) tissues collected during the 2015-2017 Sturgeon Derby events in North San Francisco Bay. The goal of this study was to investigate the distribution of selenium among sturgeon tissues to inform the toxicological and regulatory interpretation of selenium measured in non-lethally collected tissues, including muscle plugs and fin rays. This technical report provides documentation of the study and presents its major findings.
2017. Selenium in White Sturgeon Tissues: 2015 Sturgeon Derby. SFEI Contribution No. 834.
2022. Shallow Groundwater Response to Sea-Level Rise: Alameda, Marin, San Francisco, and San Mateo Counties. Pathways Climate Institute and San Francisco Estuary Institute.
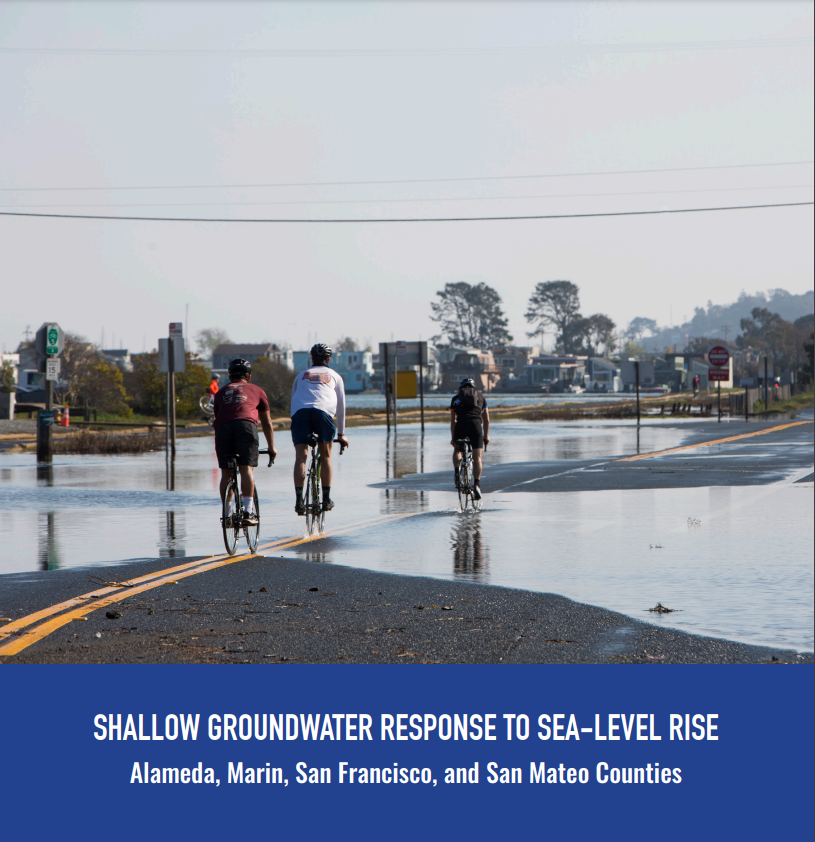 The response of shallow groundwater to sea-level rise is a relatively new field of study. For low-lying coastal communities, sea-level rise adaptation efforts must consider the potential for groundwater rise to avoid maladaptation. The need to better understand this slow and chronic threat was identified as a critical data gap in the San Francisco Bay Area’s (Bay Area’s) adaptation efforts during the Bay Area Groundwater and Sea-Level Rise Workshop in 2019.
Pathways Climate Institute LLC (Pathways) and the San Francisco Estuary Institute (SFEI) gathered and analyzed multiple data sets and collaborated with city and county partners to analyze and map the existing “highest annual” shallow groundwater table and its likely response to future sea-level rise. This effort covers four counties (Alameda, Marin, San Francisco, San Mateo) and was funded by the Bay Area Council’s California Resilience Challenge. The study focused on the San Francisco Bay side of each county and does not include the Pacific coastline of Marin, San Francisco, nor San Mateo Counties. An advisory committee composed of city and county representatives provided essential support by gathering data and reviewing depth-to-groundwater maps. Additional academic and agency advisors participated in project team meetings and informed project direction. This effort produced the following publicly available data and online tools to support adaptation efforts:
- Existing and future condition depth to groundwater GIS data available for download (geodatabase format).
- A StoryMap providing background information and graphical representations of the processes and impacts of groundwater rise.
- Web maps showing: (1) existing depth to groundwater; and (2) a comparison of the extent of emergent groundwater to the extent of coastal flooding under various sea-level-rise scenarios.
2015. Shifting Shores: Marsh Expansion and Retreat in San Pablo Bay. SFEI Contribution No. 751.
EXECUTIVE SUMMARY
As sea level rise accelerates, our shores will be increasingly vulnerable to erosion. Particular concern centers around the potential loss of San Francisco Bay’s much-valued tidal marshes, which provide natural flood protection to our shorelines, habitat for native wildlife, and many other ecosystem services. Addressing this concern, this study is the first systematic analysis of the rates of marsh retreat and expansion over time for San Pablo Bay, located in the northern part of San Francisco Bay.
Key findings:
• Over the past two decades, more of the marshes in San Pablo Bay have expanded (35% by length) than retreated (6%).
• Some areas have been expanding for over 150 years.
• Some marsh edges that appear to be retreating are in fact expanding rapidly at rates of up to 8 m/yr.
• Marsh edge change may be a useful indicator of resilience, identifying favorable sites for marsh persistence.
• These data can provide a foundation for understanding drivers of marsh edge expansion and retreat such as wind direction, wave energy, watershed sediment supply, and mudflat shape.
• This understanding of system dynamics will help inform management decisions about marsh restoration and protection.
• This study provides a baseline and method for tracking marsh edge response to current and future conditions, particularly anticipated changes in sea level, wave energy, and sediment supply.
Recommended next steps:
• This pilot study for San Pablo Bay marshes should be extended to other marshes in San Francisco Bay.
• These initial marsh expansion and retreat findings should be further analyzed and interpreted to improve our understanding of system drivers and identify management responses.
• A program for repeated assessment should be developed to identify and track changes in shoreline position, a leading indicator of the likelihood marsh survival.
1998. Ships' Ballast Water and the Introduction of Exotic Organisms into the San Francisco Estuary: Current Status of the Problem and Options for Management. SFEI Contribution No. 224. San Francisco Estuary Institute: Richmond CA.
2004. A Simple Mass Balance Model for PAH Fate in the San Francisco Estuary. SFEI Contribution No. 115. San Francisco Estuary Institute: Oakland, CA.
. 2021. Simulating Sediment Flux Through the Golden Gate. Prepared for Regional Monitoring Program for Water Quality in San Francisco Bay (RMP). SFEI Contribution No. 1033. San Francisco Estuary Institute: Richmond, CA.
2019. Small Tributaries Pollutants of Concern Reconnaissance Monitoring: Loads and Yields-based Prioritization Methodology Pilot Study. SFEI Contribution No. 817. San Francisco Estuary Institute: Richmond, CA.
2022. Small Tributaries Pollutants of Concern Reconnaissance Monitoring: Application of Storm-event Loads and Yields-Based and Congener-Based PCB Site Prioritization Methodologies. SFEI Contribution No. 1067.
Stormwater agencies in the San Francisco Bay Area are identifying watershed areas that are polluted with PCBs in order to prioritize management efforts to reduce impairment in the Bay caused by PCBs carried in stormwater. Water sampling during storms has been used to characterize PCB concentrations but management prioritization based on the comparison of concentrations between watersheds is made difficult due to variations in flow and sediment erosion between storms and in relation to varying land use. In addition, identifying PCB source areas within priority watersheds has proven complex and costly. To address these challenges, the San Francisco Bay Regional Monitoring Program (RMP) has developed two new interpretive methods based on storm-event PCB yields (PCBs mass per unit area per unit time) and fingerprints of Aroclors (commercial PCB mixtures) that make existing data more useful for decision-making.
The objectives of this study were to:
- Apply the yield method to the regional stormwater dataset and provide new rankings,
- Estimate the presence of Aroclors in samples where congener data are available
- Evaluate data weaknesses and recommend watersheds to resample, and
- Classify watersheds into high, medium, and low categories for potential management.
2019. Small Tributaries Pollutants of Concern Reconnaissance Monitoring: Pilot Evaluation of Source Areas Using PCB Congener Data. SFEI Contribution No. 956. San Francisco Estuary Institute: Richmond, CA.
. 2020. Sonoma Creek Baylands Strategy. Prepared by Sonoma Land Trust, San Francisco Estuary Institute, Point Blue Conservation Science, Environmental Science Associates, Ducks Unlimited, U.S. Fish and Wildlife Service.
2002. Sonoma Valley Historical Ecology Project, Phase 1 Final Report. SFEI Contribution No. 254. Sonoma County Water Agency and the SF Estuary Project. p 8 pp. plus apps.
2005. Sources, Pathways, and Loadings: 5-Year Work Plan (2005-2009). SFEI Contribution No. 406. San Francisco Estuary Institute. p 25.
2016. Sources, Pathways and Loadings: Multi-Year Synthesis with a Focus on PCBs and Hg. SFEI Contribution No. 773.
2008. Sources, Pathways and Loadings Workgroup: Five-Year Workplan (2008-12). SFEI Contribution No. 567. San Francisco Estuary Institute: Oakland.
2001. South Bay/Fairfield-Suisun Trace Organic Contaminants in Effluent Study. SFEI Contribution No. 236. p 53.
2003. South Bay Updates Modern Baylands Habitat Coverage Bay Area EcoAtlas Information System. SFEI Contribution No. 282. San Francisco Estuary Institute: Oakland, CA.
1998. Spatial analysis of historical, modern, and future wetlands landscapes of the Bay Area. Bay Area Wetlands Ecosystem Goals Project. SFEI Contribution No. 319.
1998. Spatial Analysis of the Baylands Ecosystem. SFEI Contribution No. 320. p 120.
1998. Spatial and Temporal Variability in the Aquatic Cycling of Chromium. SFEI Contribution No. 220. University of California: Santa Cruz, CA.
2005. Spatial Patterns of Sediment Contaminant Mixtures in San Francisco Bay. SFEI Contribution No. 450.
2008. Spatiotemporal variation of turbidity in Alameda Creek and selected tributaries: August thru December 2007. SFEI Contribution No. 547. San Francisco Estuary Institute.
2020. Special Study on Bulk Density. SFEI Contribution No. 975. San Francisco Estuary Institute: Richmond, CA. p 43.
Sediment bulk density is the total mass of mineral and organic sediment within a defined volume. It is a key variable in many research questions pertaining to Bay sediment studies but one that is often poorly quantified and can be misinterpreted. The motivation for this report comes from a recommendation by Schoellhamer et al. (2018) to compile more accurate estimates of bulk density of Bay sediments to convert between volume and mass with a higher level of certainty. Through funding and guidance from the Bay Regional Monitoring Program Sediment Work Group, this report is a first step towards compiling the available data on sediment bulk densities across Bay habitats and along salinity gradients to provide better information for resource managers and others working on sediment-related issues. This report discusses the need to know the bulk density of Bay soils to convert between sediment mass and soil volume; clarifies general definitions and common points of confusion related to sediment bulk density; compiles primary sources of bulk density measurements, secondary sources of bulk density estimates, and standard engineering estimates of bulk density for different habitats in San Francisco Bay; and, provides a database where practitioners can track, analyze, and share bulk density measurements.
2013. Statistical Design, Analysis, and Graphics for the Guadalupe River Watershed Assessment 2012. SFEI Contribution No. 687. San Francisco Estuary Institute: Richmond, CA.
2018. Statistical Methods Development and Sampling Design Optimization to Support Trends Analysis for Loads of Polychlorinated Biphenyls from the Guadalupe River in San Jose, California, USA. SFEI Contribution No. 876. Applied Marine Sciences: Livermore, CA.
1992. Status and Assessment of Selected Monitoring Programs in the San Francisco Esturary. SFEI Contribution No. 172. San Francisco Estuary Institute: Richmond, Ca. p 128.
1990. Status and Trends Report on Dredging and Waterway Modification in the San Francisco Estuary. SFEI Contribution No. 159. San Francisco Estuary Project: Oakland, CA.
1991. Status and Trends Report on Pollutants in the San Francisco Estuary. SFEI Contribution No. 161. San Francisco Estuary Project: Oakland, CA.
1991. Status and Trends Report on Pollutnats in the San Francisco Estuary. San Francisco Bay-Delta Aquatic Habitat Institute: Richmond CA. p 291.
2018. Status & Trends Monitoring Design: 2018 Update. San Francisco Estuary Institute : Richmond, CA.
2023. Stevens Creek Reservoir – Forecast Informed Reservoir Operation (FIRO) Phase One Report. . SFEI Contribution No. 1120. Prepared for SCV Water District.
2022. Strategy for In-Bay Fate Modeling to Support Contaminant and Sediment Management in San Francisco Bay. SFEI Contribution No. 1090. San Francisco Estuary Institute: Richmond, California.
This report presents a strategy and multi-year workplan for modeling polychlorinated biphenyls (PCBs), contaminants of emerging concern (CECs), and sediment in San Francisco Bay (the Bay). Robust in-Bay fate modeling is needed to address priority management questions that have been identified for these constituents.
The strategy for in-Bay modeling presented in this report is a major element of a broader, integrated strategy that is being developed across RMP Workgroups for modeling contaminants flowing from the Bay watersheds and other pathways into the Bay. The broader project is expected to yield an integrated strategy in 2022, followed by implementation of a pilot effort in 2023. Coordination of the in-Bay modeling effort with the broader integrated strategy and other modeling work (e.g., nutrient modeling under the Nutrient Management Strategy) will be critical to optimizing use of the funds allocated to modeling.
2007. Stream Inventory Report for La Honda Creek: Prepared for the Midpeninsula Regional Open Space District. SFEI Contribution No. 529. San Francisco Estuary Institute.
2023. Structure-from-motion derived orthomosaic imagery and digital surface models (DSMs) from the intertidal region at Whale's Tail Marsh, South San Francisco Bay, CA. United States Geological Survey: South San Francisco Bay, CA.
This data release presents digital surface models (DSMs) and orthomosaic images of the Whale's Tail Marsh region of South San Francisco Bay, CA. The data were created using structure-from-motion (SfM) processing of repeat aerial imagery collected from fixed-wing aircraft. The raw images were acquired from an approximate altitude of 427 meters (1,400 feet) above ground level (AGL), using a Hasselblad A6D-100c camera fitted with an HC 80 lens, resulting in a nominal ground-sample-distance (GSD) of 2.5 centimeters per pixel. The acquisition flight lines were designed to provide approximately 50 percent overlap between adjacent flight lines (sidelap), with approximately 70 percent overlap between sequential images along the flight line (forelap). Survey control was established using an onboard camera-synchronized dual-frequency GPS system as well as ground control points (GCPs) distributed throughout the survey area and measured using survey-grade post-processed kinematic (PPK) GPS. Both the data from the onboard GPS and from the GPS used to measure the GCPs were post-processed using a nearby Continuously Operating Reference Station (CORS) operated by the National Geodetic Survey (NGS). Structure-from-motion processing of these data was conducted using a "4D" processing workflow in which imagery from each of the different acquisition dates were co-aligned to increase relative spatial precision between the final data products.
1995. Studies of the San Francisco Bay, California, Estuarine Ecosystem. USGS: Menlo Park, CA. pp 95-378.
1994. Studies of the San Francisco Bay, California, Estuarine Ecosystem. SFEI Contribution No. 1. USGS: Menlo Park, CA. pp 94-82.
2021. Study of Per- and Polyfluoroalkyl Substances in Bay Area POTWs: Phase 1, Sampling and Analysis Plan. SFEI Contribution No. 1020. San Francisco Estuary Institute: Richmond, CA.
2022. Study of Per- and Polyfluoroalkyl Substances in Bay Area POTWs: Phase 2 Sampling and Analysis Plan. San Francisco Estuary Institute: Richmond, CA.
1988. Subsides in the Central Utah Project: Whose CUP is Running over?. Report for the Natural Resources Defense Council: San Francisco, CA.
2001. Success factors in human-dispersed organisms. Page 8 in:. University of Reading, UK. British Ecological Society, London. p p. 8.
2014. Suisun Bay Ammonium Synthesis. SFEI Contribution No. 706. San Francisco Estuary Institute: Richmond, CA. p 191.
2022. Summary and Evaluation of Bioaccumulation Tests for Total Polychlorinated Biphenyls (PCBs) Conducted by San Francisco Bay Dredging Projects. SFEI Contribution No. 1092. San Francisco Estuary Institute: Richmond, California.
The Dredged Material Management Office (DMMO) is responsible for annually approving dredging and disposal of millions of cubic yards of sediment to maintain safe navigation in San Francisco Bay. Dredged sediment is characterized for physical, chemical, and biological characteristics to ensure sediment disposed of in the Bay or at beneficial use locations does not cause adverse environmental impacts. Bioaccumulation thresholds and total maximum daily loads (TMDLs) have been established for several contaminant classes, including PCBs, and are used by the DMMO to determine whether sediment contaminant levels trigger subsequent bioaccumulation testing. Sediment with contaminant concentrations above any TMDL levels cannot be disposed of within the Bay but may be further evaluated for upland reuse and ocean disposal. The objective of this study was to evaluate PCB bioaccumulation data from navigational dredging projects to assess the existence of correlations between sediment chemistry and bioaccumulation test results. The motivation for this study was to determine whether the current PCB bioaccumulation trigger is effective in differentiating sediment bioaccumulation concerns. The DMMO may use the results of this study to inform evaluation requirements for PCBs, particularly in support of modifying the terms of the Long-term Management Strategy for San Francisco Bay (LTMS) programmatic Essential Fish Habitat (EFH) agreement concerning PCB bioaccumulation testing.
2016. Summary and Evaluation of Delta Subregions for Nutrient Monitoring and Assessment. SFEI Contribution No. 789.
2021. Summary for Managers: Non-targeted Analysis of Stormwater Runoff following the 2017 Northern San Francisco Bay Area Wildfires. SFEI Contribution No. 1045. San Francisco Estuary Institute: Richmond, CA.
Urban-wildland interfaces in the western US are increasingly threatened by the growing number and intensity of wildfires, potentially changing the type of contaminants released into the landscape as more urban structures are burned. In October 2017, the Tubbs, Nuns, and Atlas wildfires devastated communities in Northern California (Figure 1), burning over 8,500 buildings and 210,000 acres of land in the span of 24 days (California Department of Forestry and Fire Protection 2017). Together, these wildfires were the most destructive and costliest fires in the history of California at that time (California Department of Forestry and Fire Protection 2019).
Post-wildfire monitoring efforts in impacted watersheds typically focus on a few well-established water quality and chemistry concerns (McKee et al. 2018). Few studies go beyond these limited targeted analyses and attempt to identify the multitude of other fire-related compounds that are released from or form as the result of combustion of residential, commercial, and industrial structures in urban-wildland interfaces. Some of these unidentified compounds may be toxic to aquatic ecosystems or human health, and may pose risks to wildlife or in water bodies that act as drinking water supplies to nearby communities.
2003. Summary of 10 years of sediment toxicity monitoring for the San Francisco Estuary RMP. SFEI Contribution No. 281. San Francisco Estuary Institute.
2002. Summary of Crissy Field Monitoring Elements. San Francisco Estuary Institute.
2009. Summary of Current Water Quality Monitoring Programs in the Delta. San Francisco Estuary Institute: Oakland, CA.
2004. Summary of data and analyses indicating that exotic species have impaired the beneficial uses of certain California waters. SFEI Contribution No. 382. San Francisco Estuary Institute: Oakland.
2000. Summary of existing information in the watershed of Sonoma Valley in relation to the Sonoma Creek Watershed Restoration Study and recommendations on how to proceed. SFEI Contribution No. 345. San Francisco Estuary Institute.
2002. Summary of Suspended-Sediment Concentration Data, San Francisco Bay, California, Water Year 2000. SFEI Contribution No. 242. US Geological Survey Open-File Report. pp 96-591.
1996. Summary of Suspended-Solids Concentration Data, San Francisco Bay, California, Water Year 1994. SFEI Contribution No. 14. US Geological Survey Open-File report. pp 95-776.
1996. Summary of Suspended-Solids Concentration Data, San Francisco Bay, California, Water Year 1995. SFEI Contribution No. 13. US Geological Survey Open-File Report. pp 96-591.
2020. Summary of Water Year 2017 precipitation, discharge, and sediment conditions at selected locations in Arroyo de la Laguna watershed, with a focus on Arroyo Mocho. SFEI Contribution No. 912. San Francisco Estuary Institute: Richmond, CA.
This report summarizes the precipitation, discharge, and sediment conditions observed from October 1, 2016 to September 30th, 2017 (Water Year (WY) 2017) in the Arroyo de la Laguna watershed, with a focus on the Arroyo Mocho watershed. This information was collected by the Zone 7 Water Agency to support operation and maintenance of their flood control facilities. Additionally, this and similar information collected in WY 2018 and 2019 will be utilized to update the Arroyo Mocho watershed sediment budget (Pearce et al, 2020).
2009. Summary Report: Green Sturgeon, Longfin Smelt, and Dredging Operations in the San Francisco Estuary. SFEI Contribution No. 598. San Francisco Estuary Institute: Oakland, Ca.
2014. Sunset Circle Vegetated Swale and Infiltration System (Case Study Site and Technical Reports). SFEI Contribution No. 796.
2018. Support for Sediment Bioaccumulation Evaluation: Toxicity Reference Values for the San Francisco Bay. SFEI Contribution No. 916. San Francisco Estuary Institute : Richmond, CA.
1988. A Survey of User Needs for Data Relating to Environmental and Water Quality in the San Francisco Estuary. SFEI Contribution No. 150. Aquatic Habitat Institute: Richmond, CA. p 48.
2020. Suspended-sediment Flux in the San Francisco Estuary; Part II: the Impact of the 2013–2016 California Drought and Controls on Sediment Flux. Estuaries and Coasts. SFEI Contribution No. 1137. Estuaries and Coasts.
Recent modeling has demonstrated that sediment supply is one of the primary environmental variables that will determine the sustainability of San Francisco Estuary tidal marshes over the next century as sea level rises. Therefore, understanding the environmental controls on sediment flux within the San Francisco Estuary is crucial for optimal planning and management of tidal marsh restoration. Herein, we present suspended-sediment flux estimates from water year (WY) 2009–2016 from the San Francisco Estuary to investigate the environmental controls and impact of the record 2013–2016 California drought. During the recent drought, sediment flux into Lower South Bay, the southernmost subembayment of the San Francisco Estuary, increased by 345% from 114 kt/year from WY 2009 to 2011 to 508 kt/year from WY 2014 to 2016, while local tributary sediment flux declined from 209 to 51 kt/year. Total annual sediment flux from WY 2009 to 2011 and 2014 to 2016 can be predicted by total annual freshwater inflow from the Sacramento-San Joaquin Delta (R2 = 0.83, p < 0.01), the primary source of freshwater input into the San Francisco Estuary. The volume of freshwater inflow from the Sacramento-San Joaquin Delta is hypothesized to affect shoal-to-channel density gradients that affect sediment flux from broad, typically more saline and turbid shoals, to the main tidal-channel seaward of Lower South Bay. During the drought, freshwater inflow from the Sacramento-San Joaquin Delta decreased, and replacement of typically more saline shoal water was reduced. As a result, landward-increasing cross-channel density gradients enhanced shoal-to-channel advective flux that increased sediment available for tidal dispersion and drove an increase in net-landward sediment flux into Lower South Bay.
2023. Suspended Sediment Loads Analysis of Four Creeks in the San Francisco Bay Area. SFEI Contribution No. 1134. San Francisco Estuary Institute: Richmond, CA.
2009. Sustainable Cotton Project. SFEI Contribution No. 592. San Francisco Estuary Institute: Oakland, Ca.
2005. SWAMP Collaboration Workshop. SFEI Contribution No. 407.
2011. SWAMP/RMP/Bight Program Report on Contaminants in Fish from the California Coast. California State Water Resources Control Board: Sacramento, CA.
2017. Sycamore Alluvial Woodland: Habitat Mapping and Regeneration Study. SFEI Contribution No. 816.
This study investigates the relative distribution, health, and regeneration patterns of two major stands of sycamore alluvial woodland (SAW), representing managed and natural settings. Using an array of ecological and geomorphic field analyses, we discuss site characteristics favorable to SAW health and regeneration, make recommendations for restoration and management, and identify next steps. Findings from this study will contribute to the acquisition, restoration, and improved management of SAW as part of the Santa Clara Valley Habitat Plan (VHP).
. 2023. Sycamore Alluvial Woodland Pilot Study Implementation Guidelines. Prepared for Zone 7 Water Agency and US Environmental Protection Agency’s Water Quality Improvement Fund. In collaboration with San Francisco Estuary Institute.
This document supports planting-based approaches for sycamore enhancement by providing site-level revegetation techniques for installing, maintaining and monitoring sycamore plantings.
2018. Sycamore Alluvial Woodland Planting Guide. SFEI Contribution No. 901.
2023. Sycamore Alluvial Woodland Restoration and Enhancement Suitability Study. In collaboration with Alameda County Flood Control and Water Conservation District, Zone 7. Prepared for the US Environmental Protection Agency’s Water Quality Improvement Fund. SFEI Contribution No. 1128. San Francisco Estuary Institute: Richmond, CA.
 The “Sycamore Alluvial Woodland Restoration and Enhancement Suitability Study” addresses distribution and regeneration patterns and restoration strategies of sycamore alluvial woodland (SAW) habitat, a unique and relatively rare native vegetation community adapted to California’s intermittent rivers and streams. The report was produced by SFEI and H. T. Harvey & Associates, as part of the US EPA Water Quality Improvement Fund Preparing for the Storm grant, led by Zone 7 Water Agency.